Product Experiments
and Digital Marketing
2017–2018
Overview
Team: Product Marketers, Analytics, User Researcher, Software Engineer
Role: Designer
Info
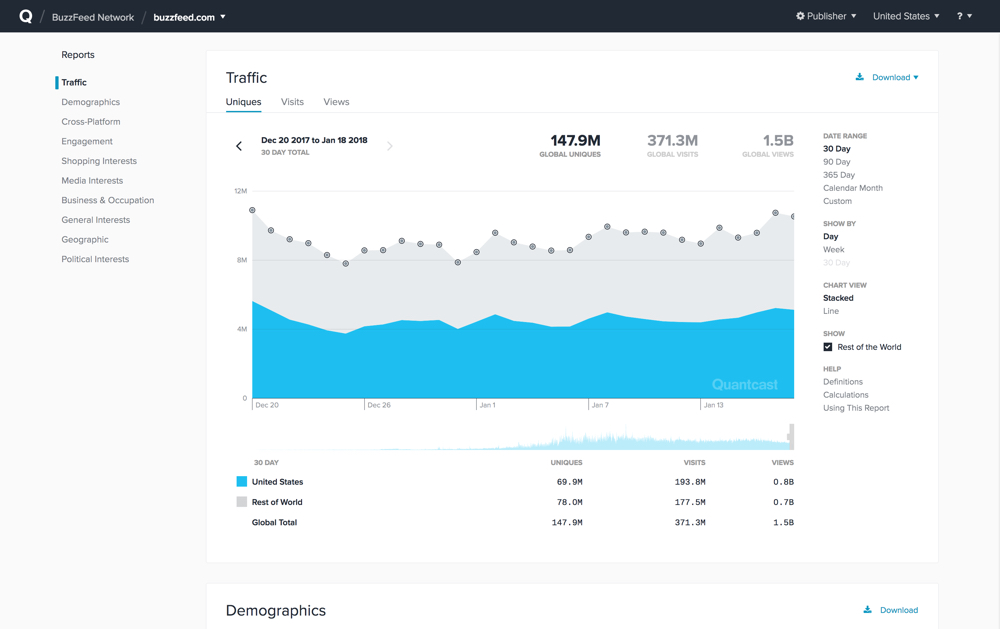
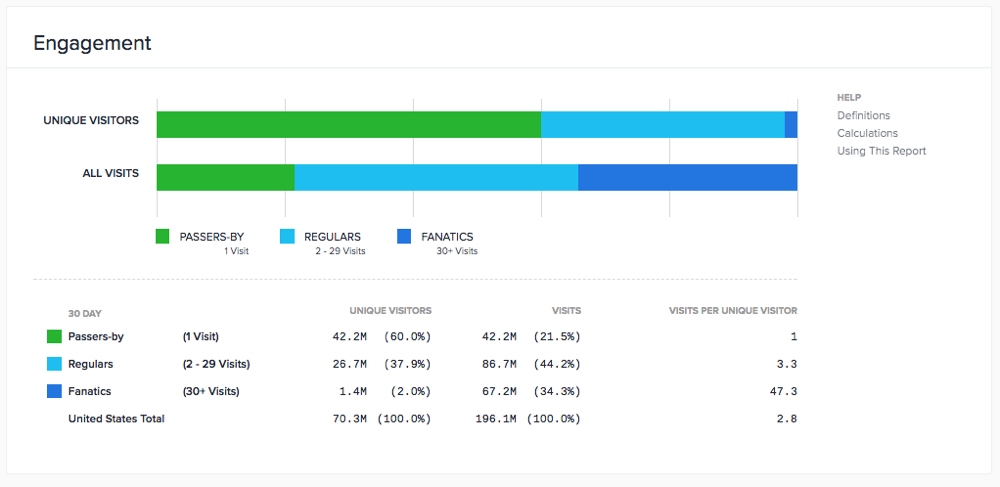
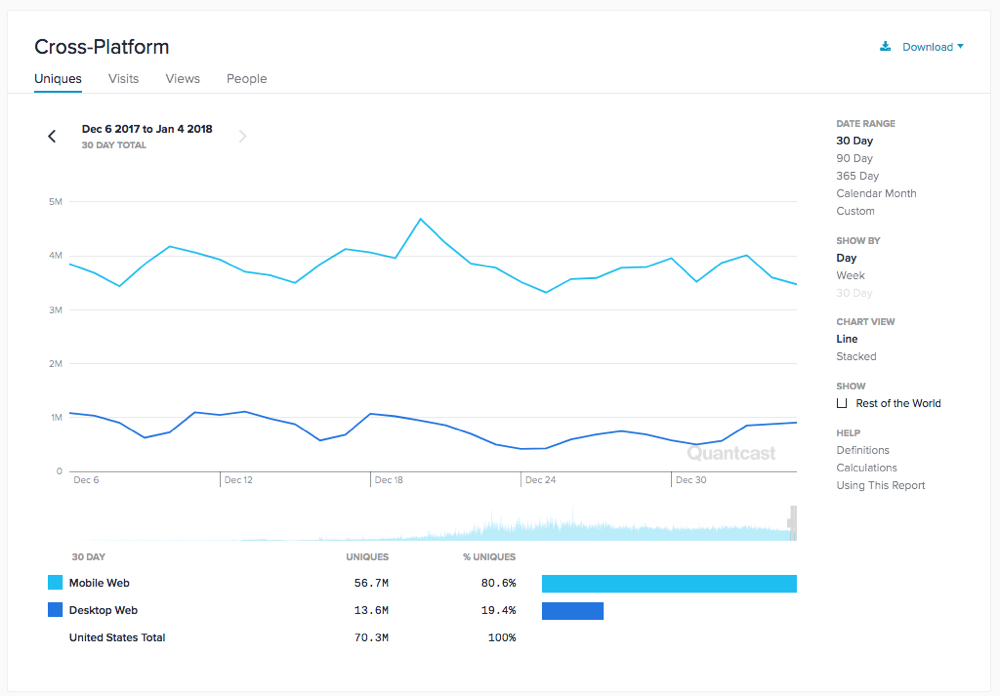
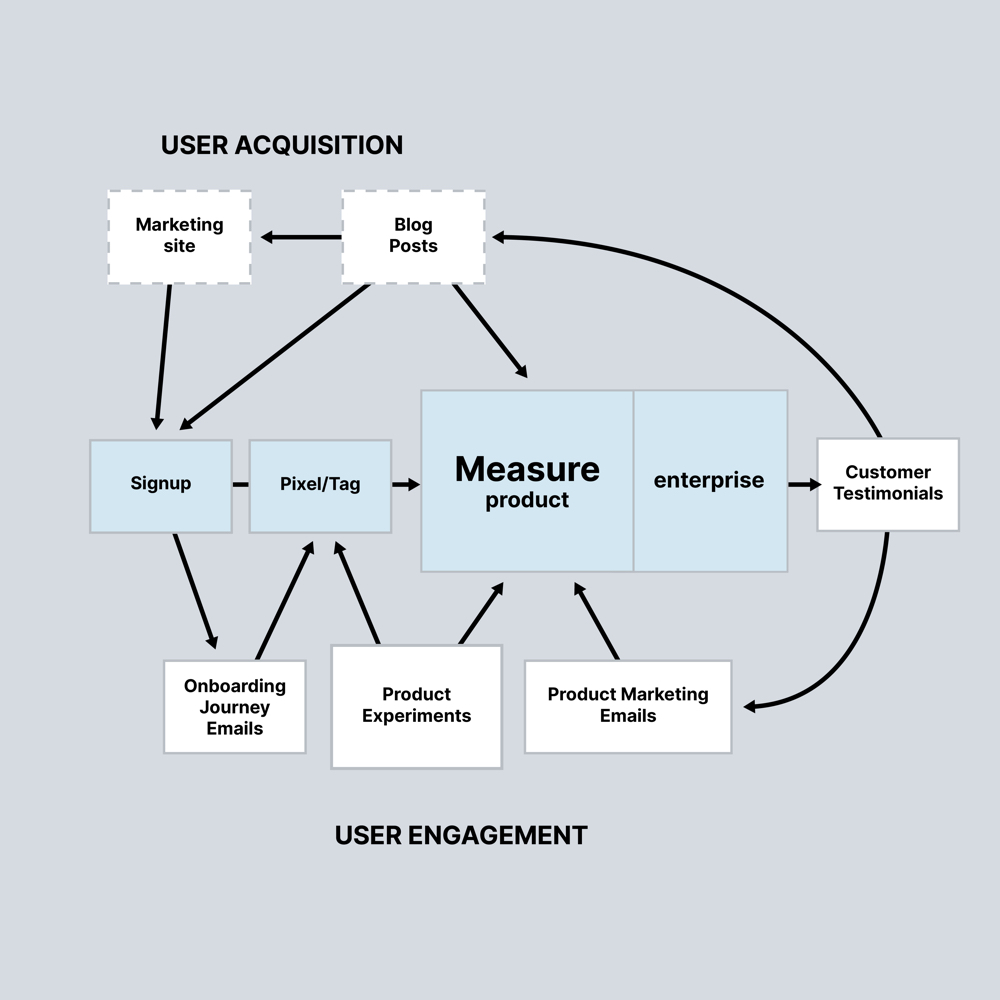
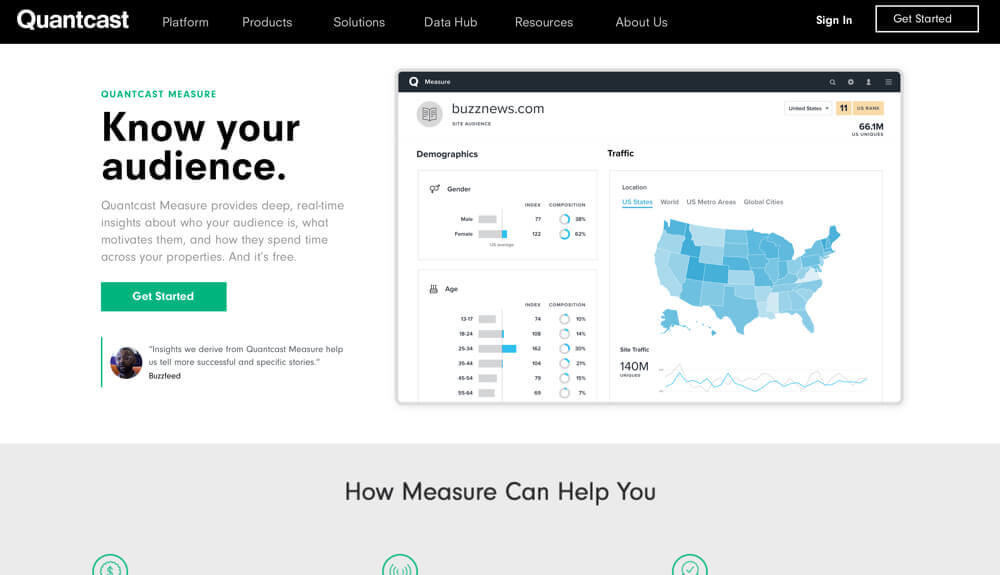
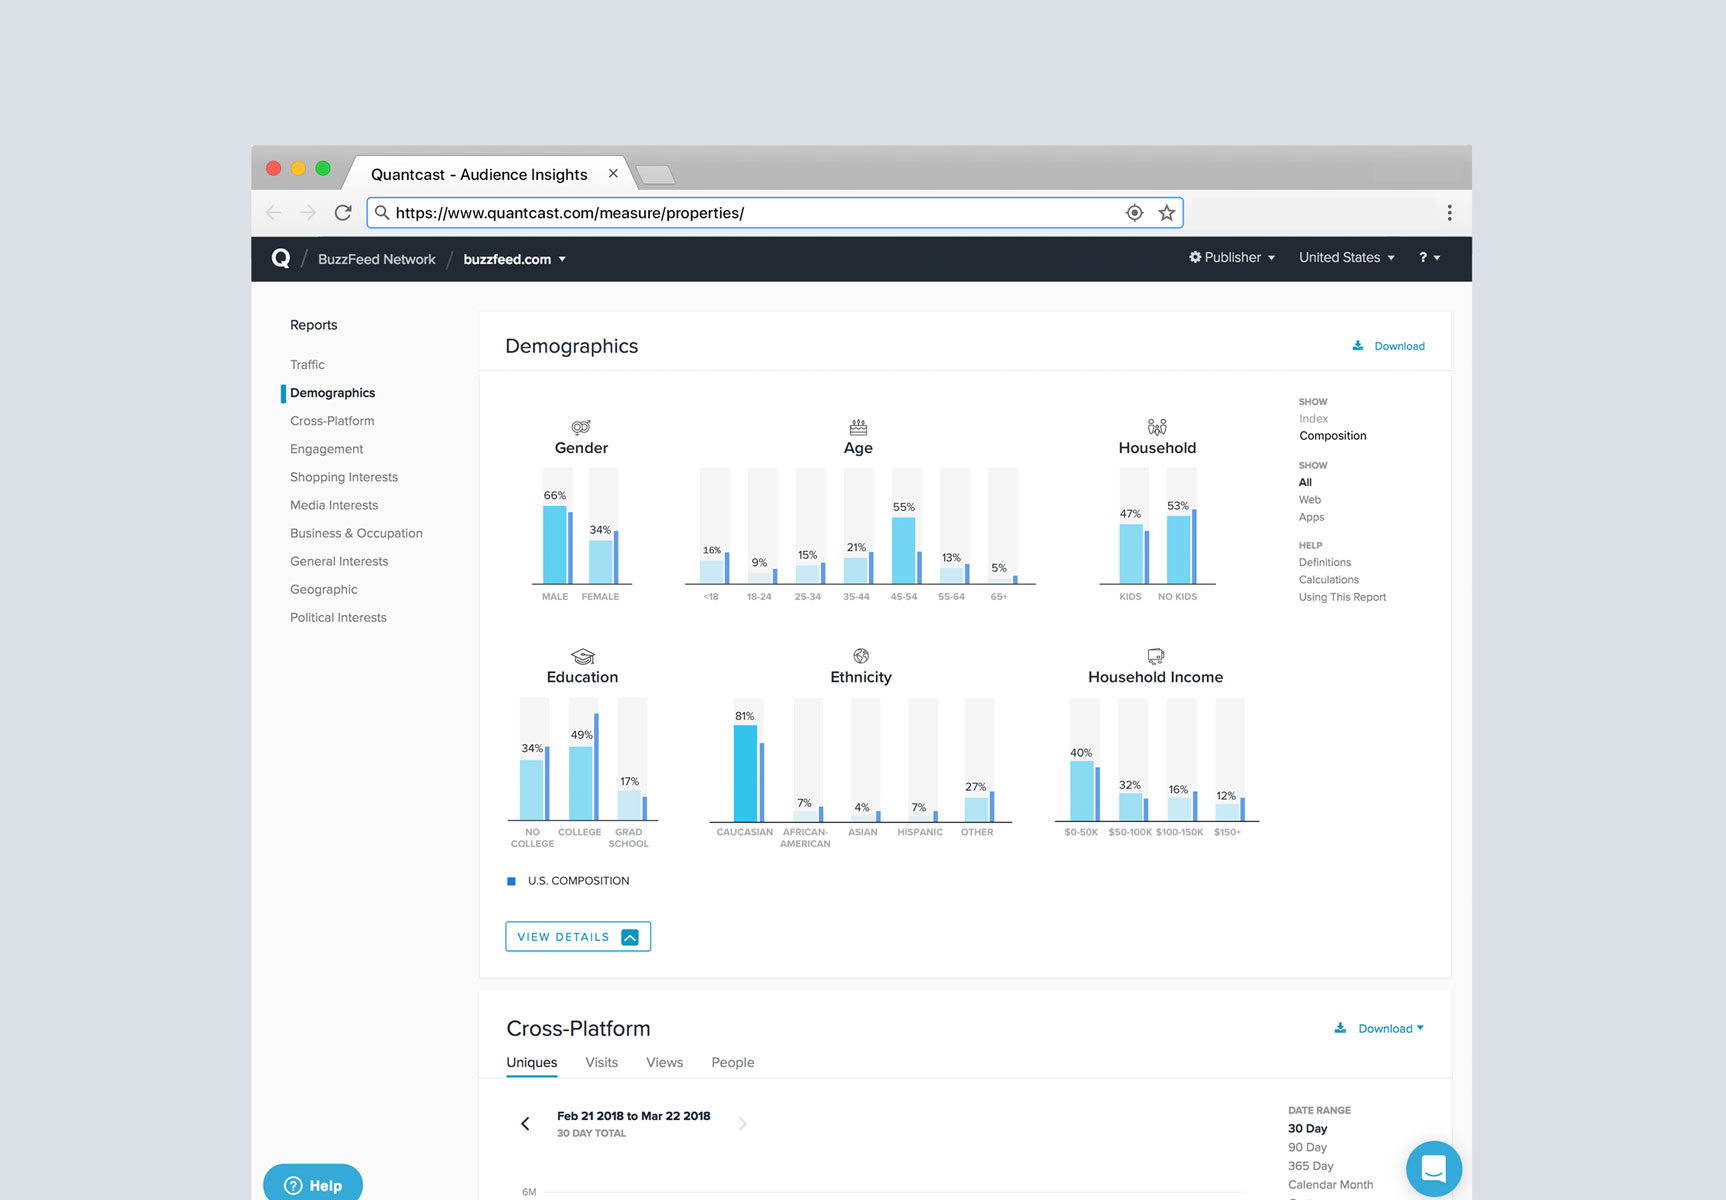
The Growth team was responsible for growing the self-serve customer base in Quantcast Measure, our website audience analytics tool. To achieve this, we ran A/B tests on the product, sent onboarding emails to support Measure "pixel" installation, informed users about new features through product emails, created blog content, and conducted user research.
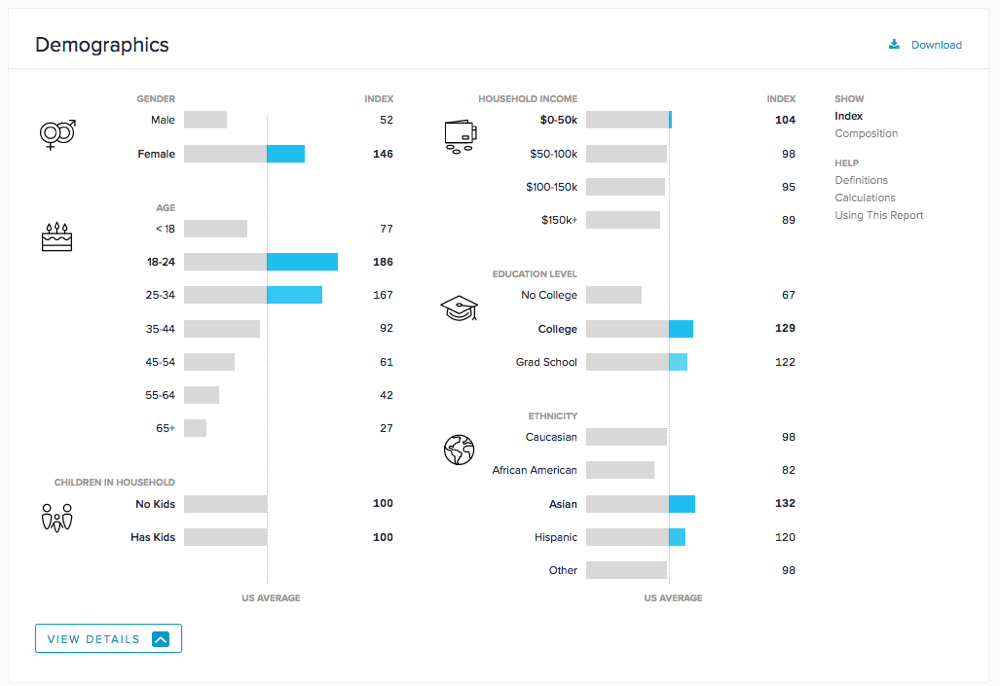
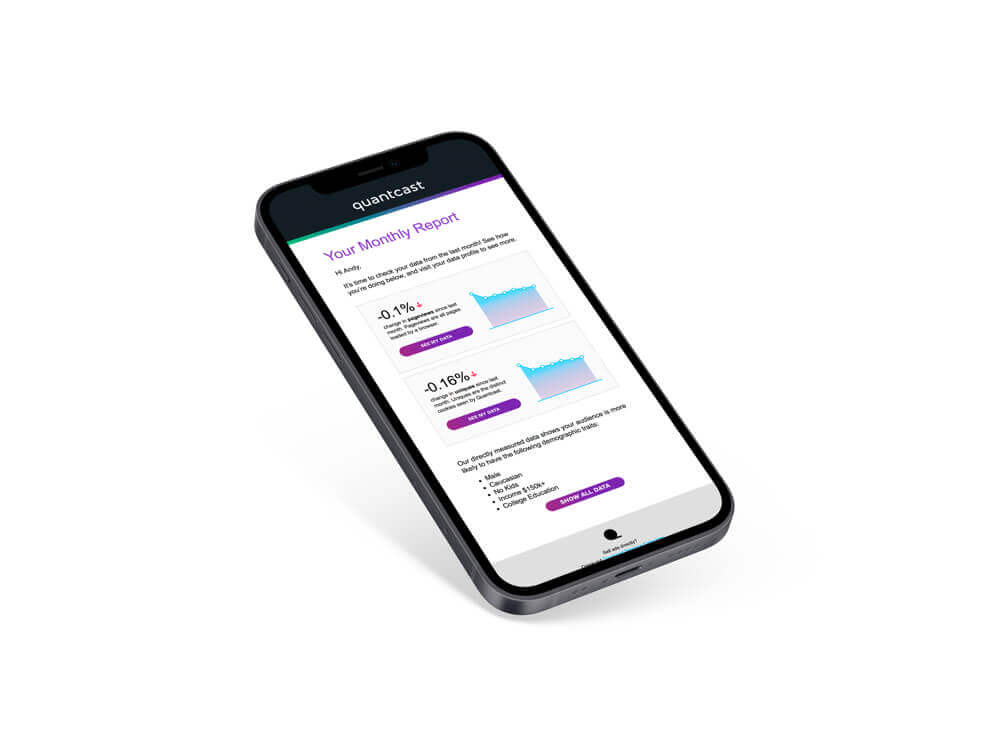
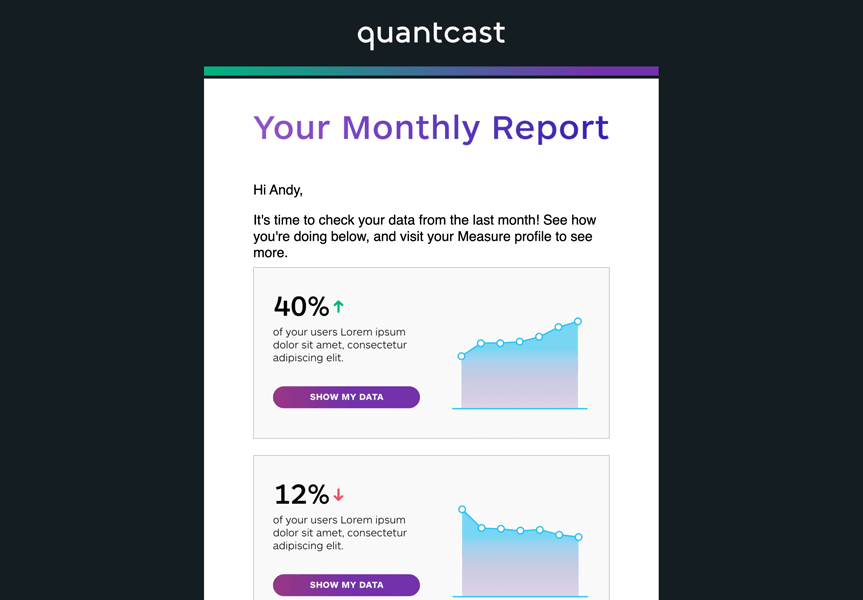
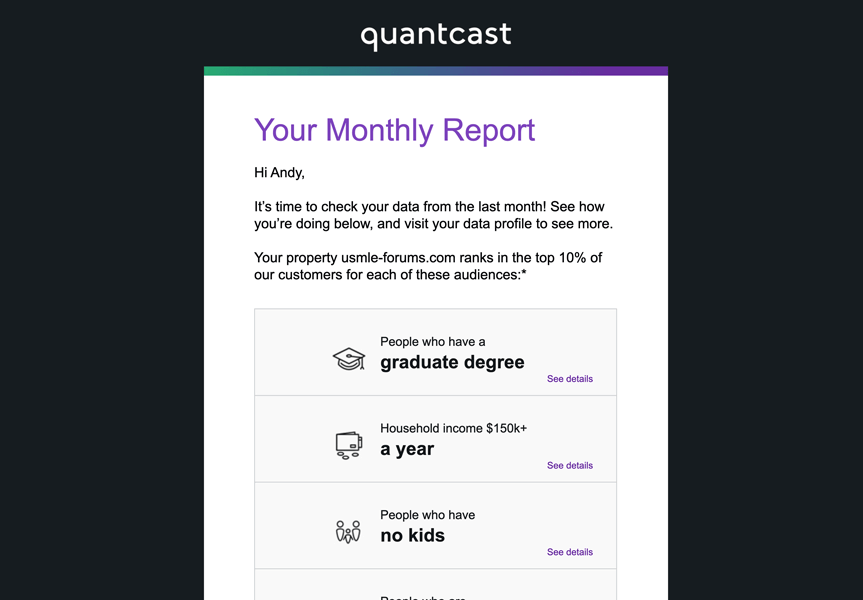
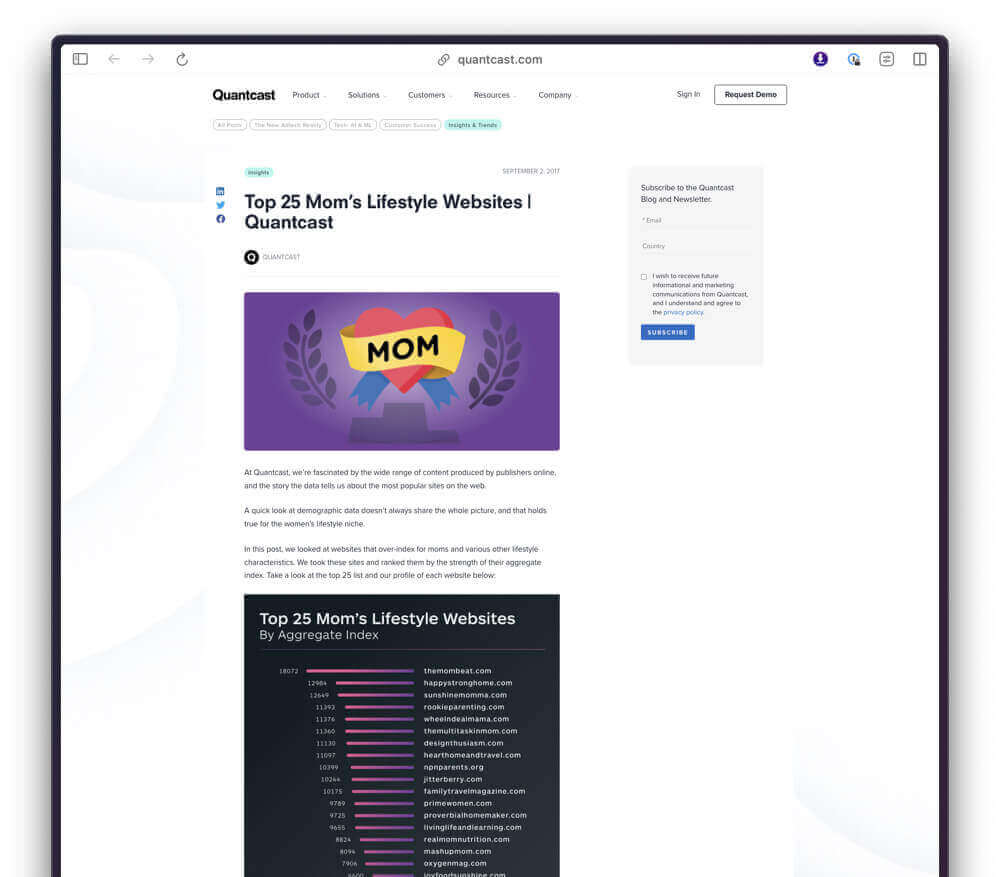
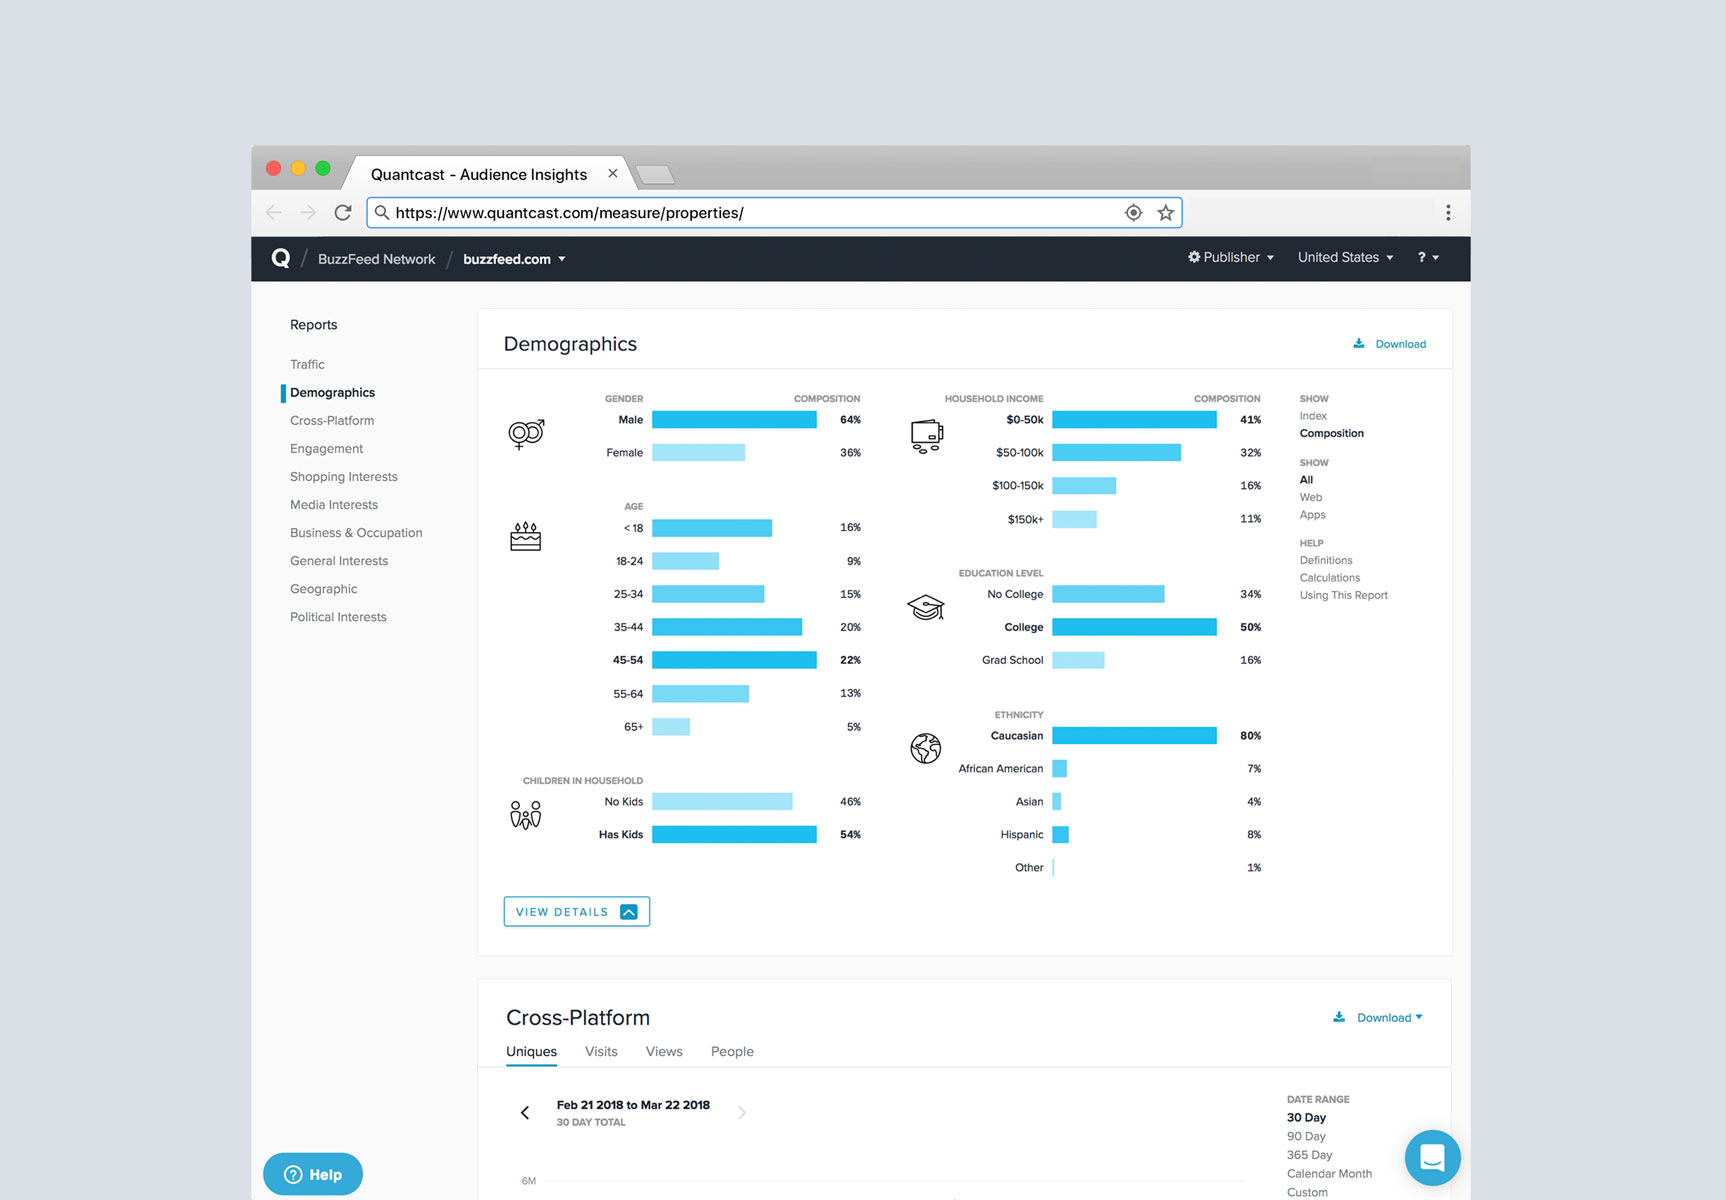
We generated monthly data reports to encourage user engagement with their profiles. Since our product lacked automated reporting features, we manually compiled these reports using data pulls. The challenge for me was to create versatile graphics that could serve multiple purposes.
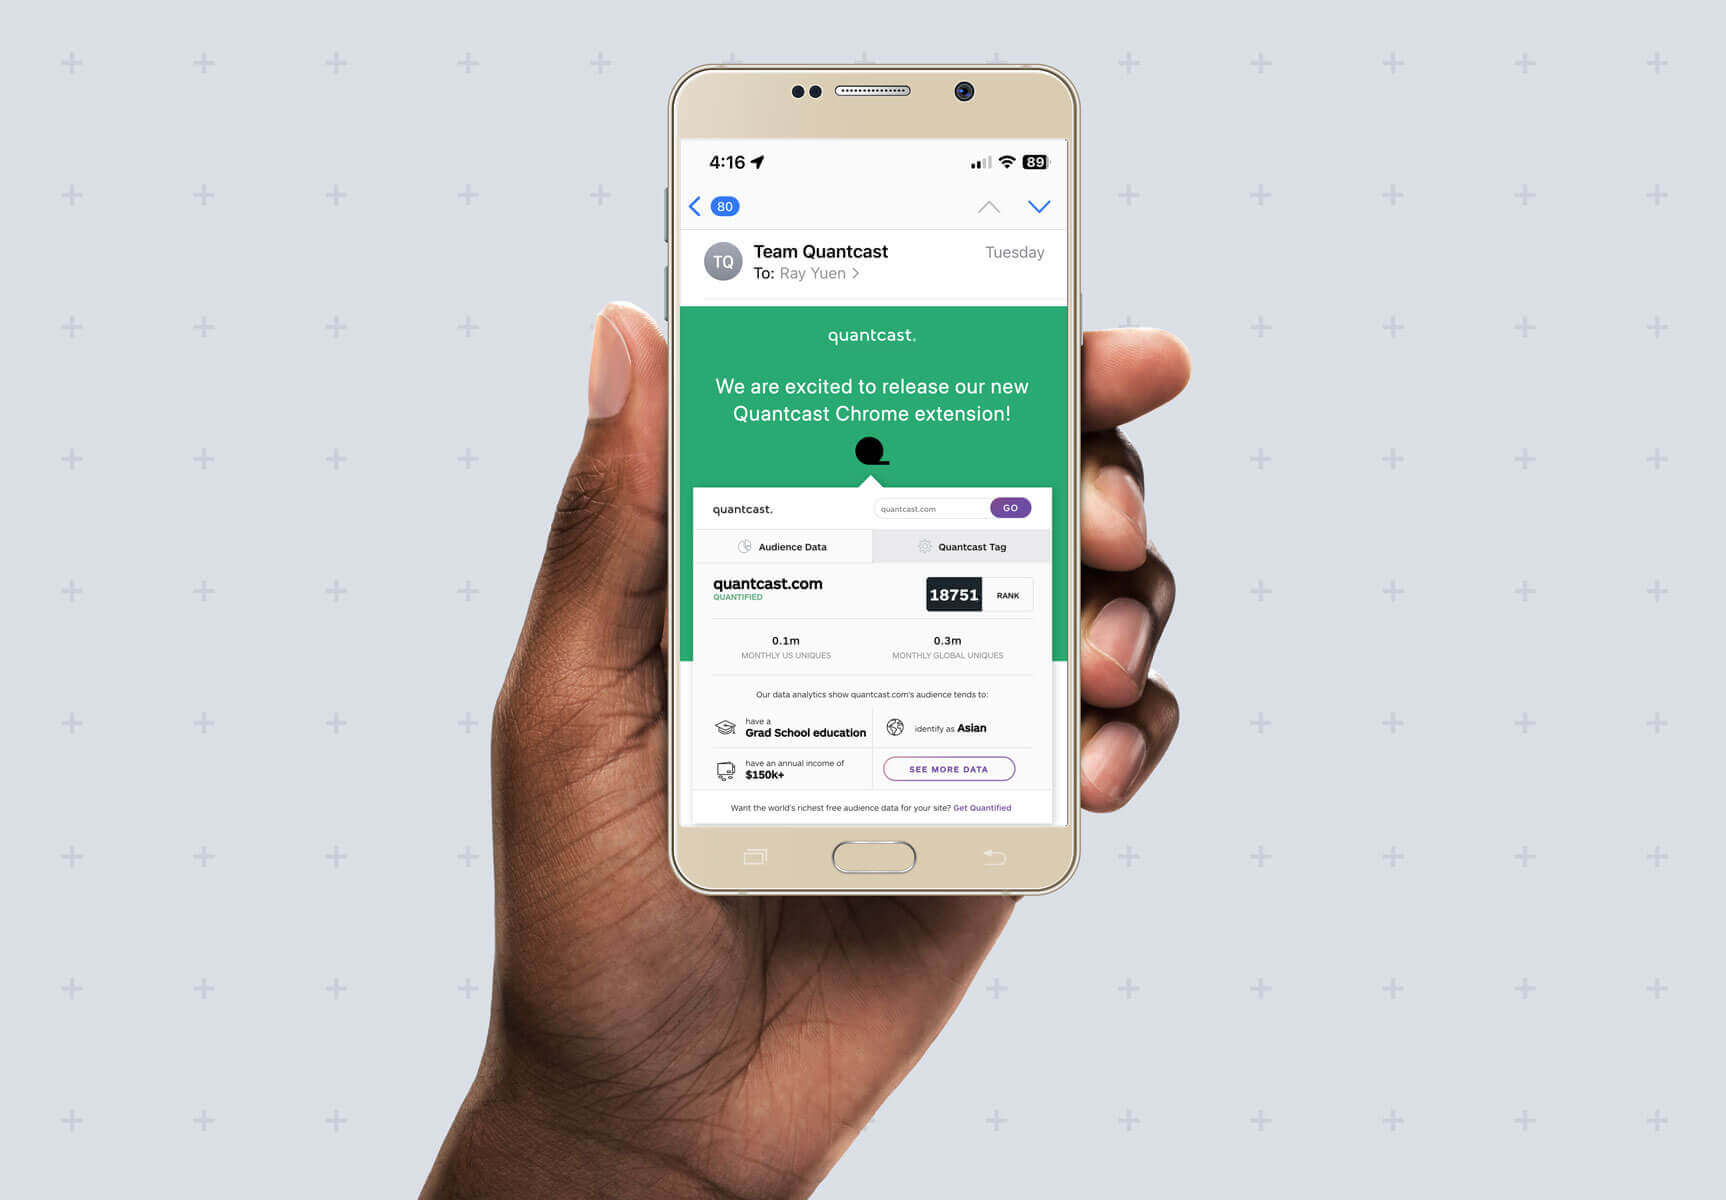
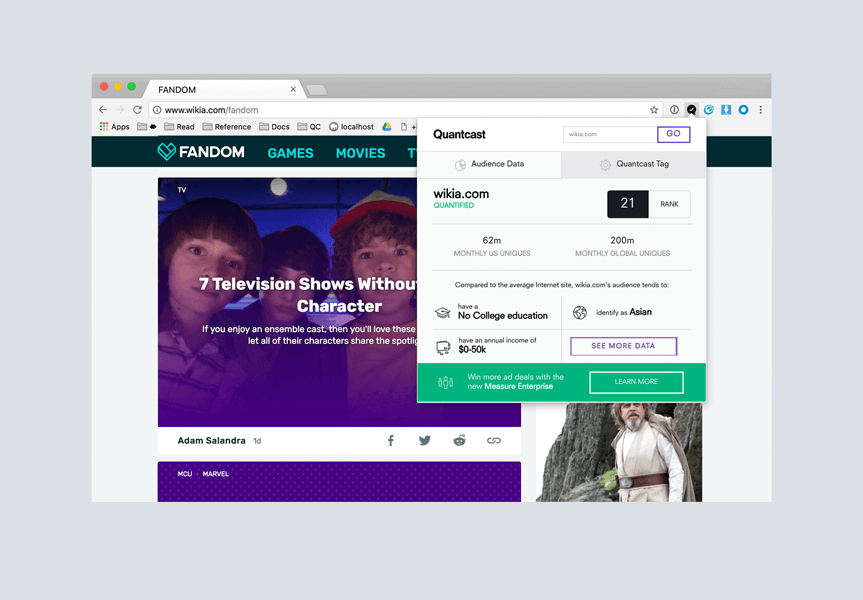
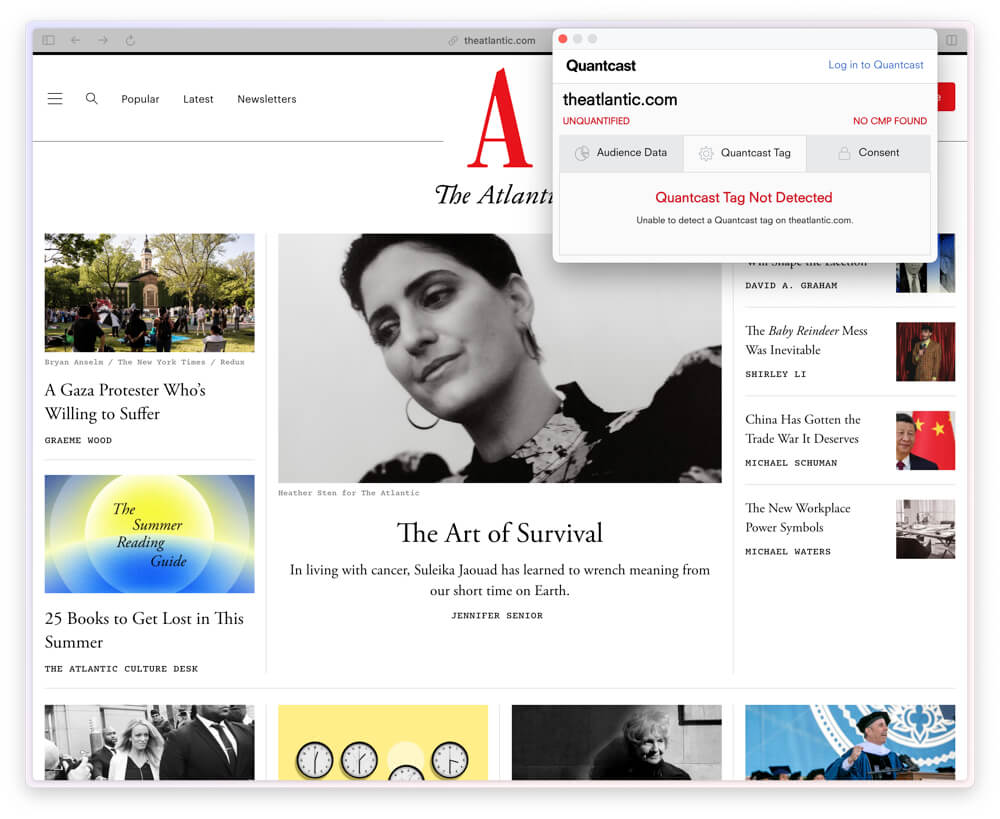
To increase engagement with the analytics tool, we developed a Chrome extension. This extension displayed basic traffic and demographic data, facilitated basic market research on websites, and helped give error messages during the tag/pixel installation process.
In-Product Experiments
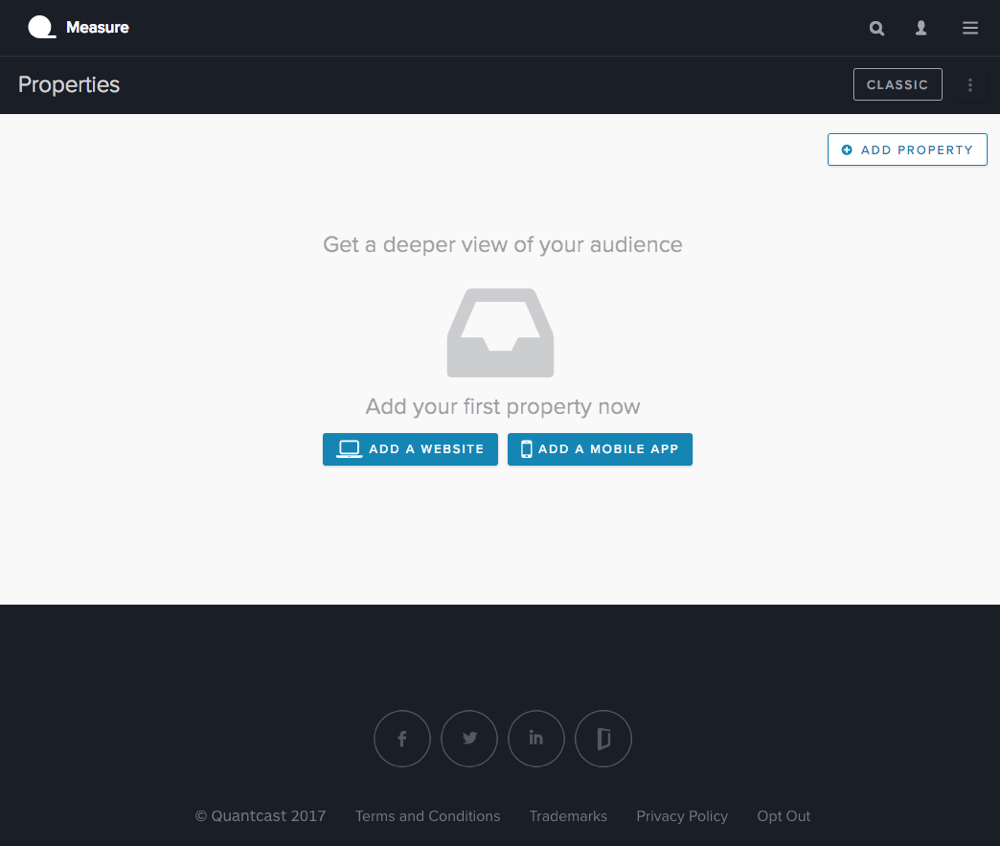
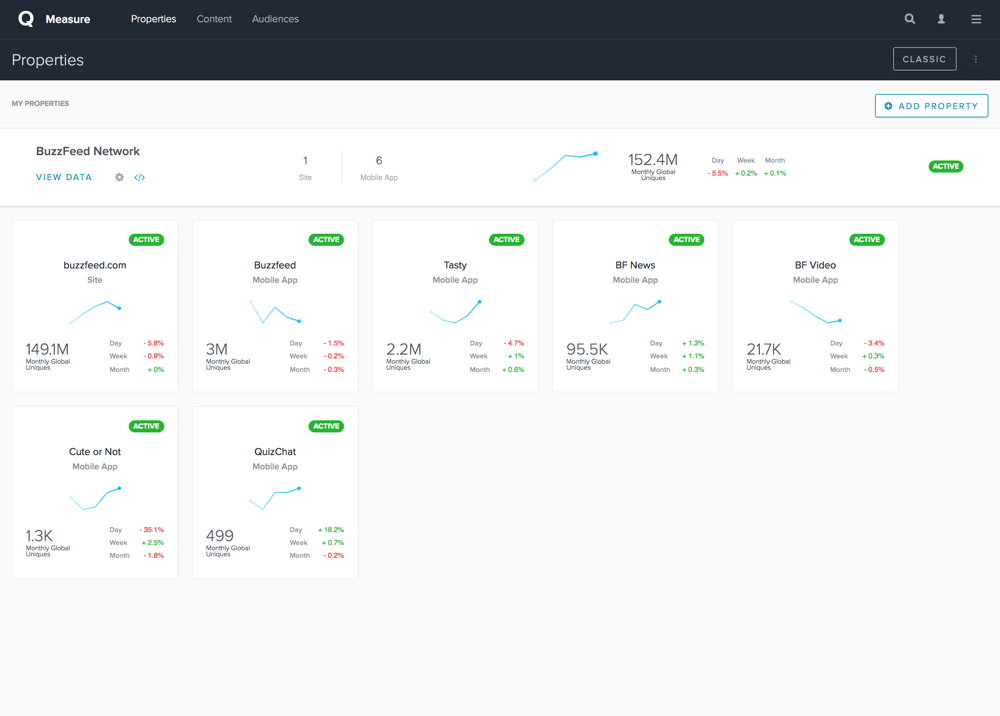
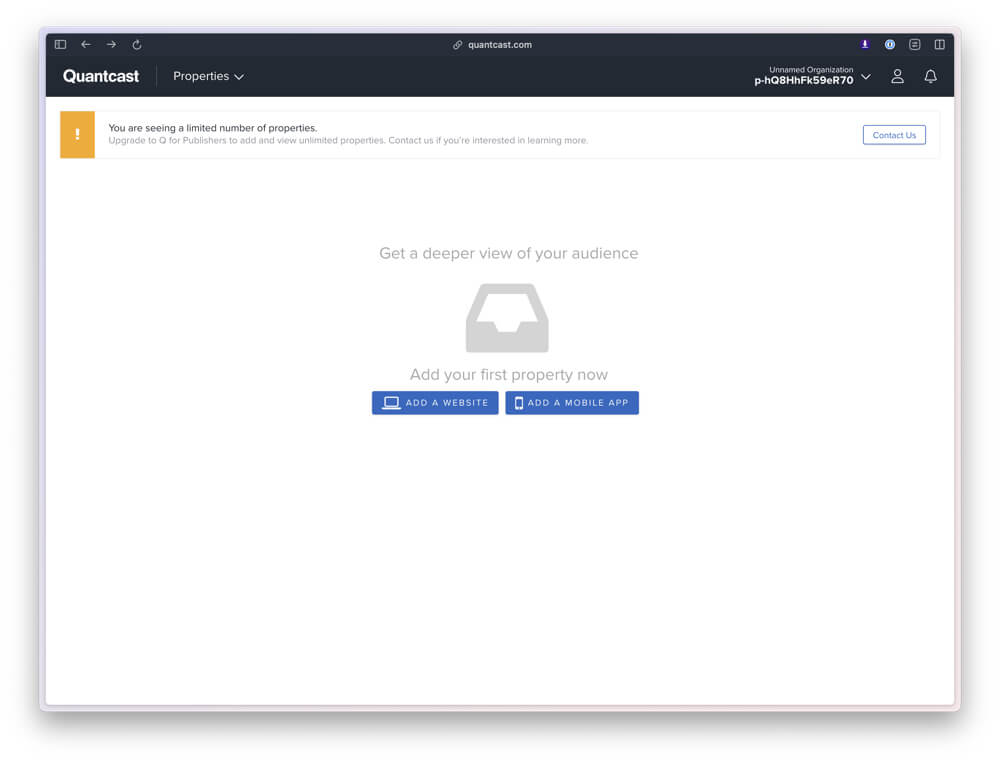
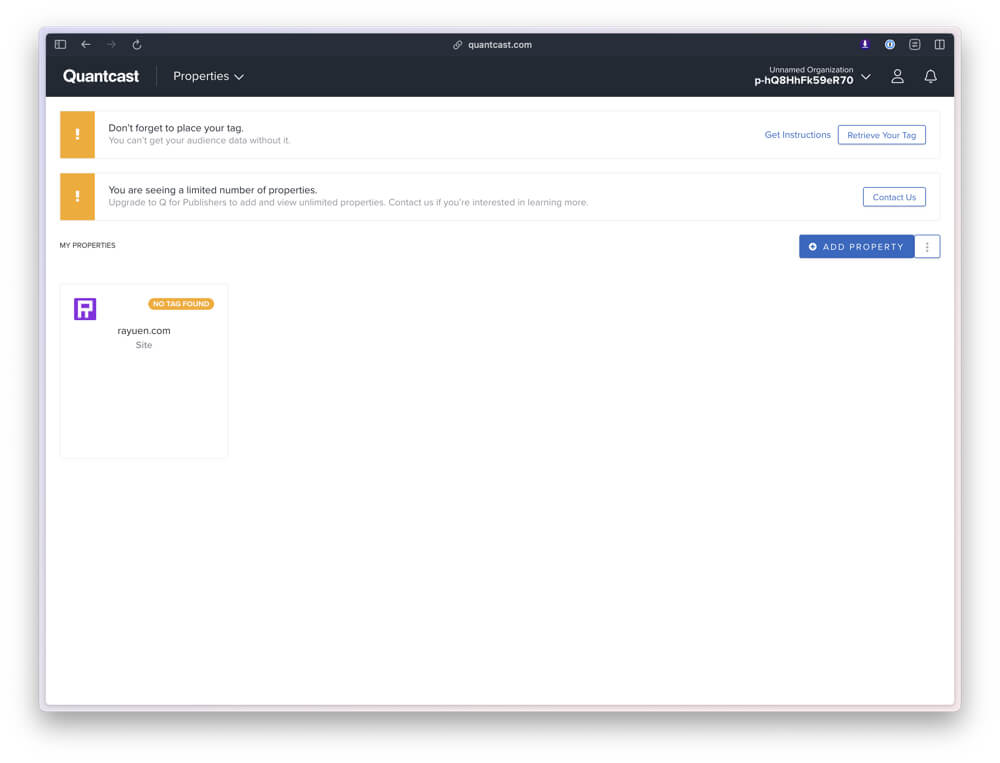
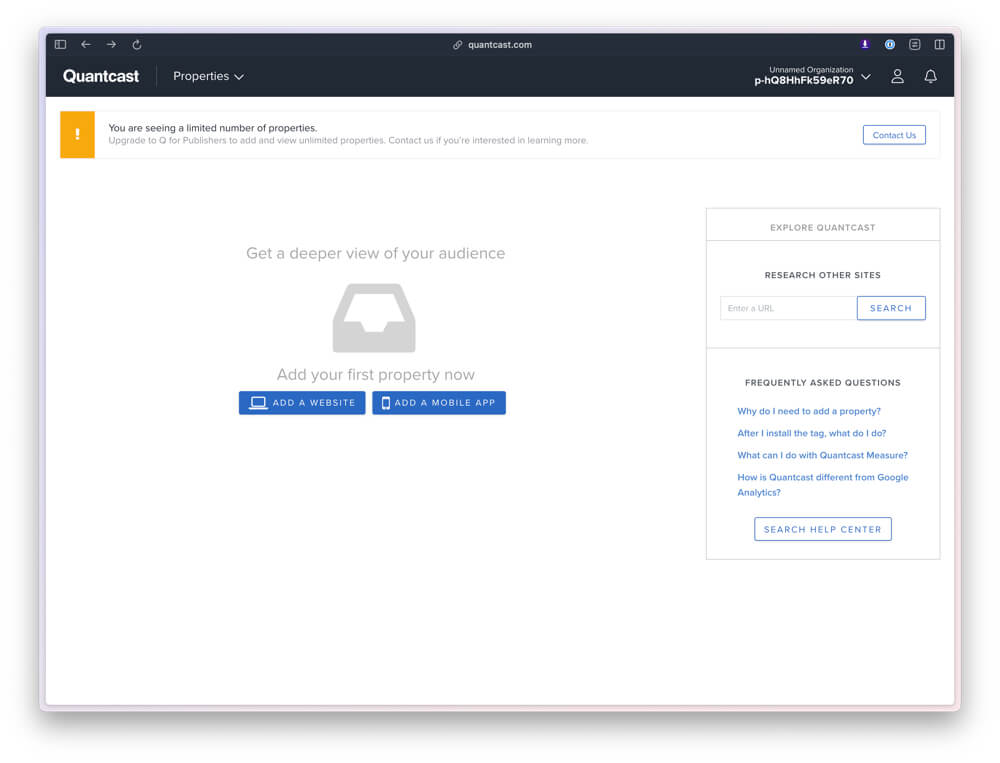
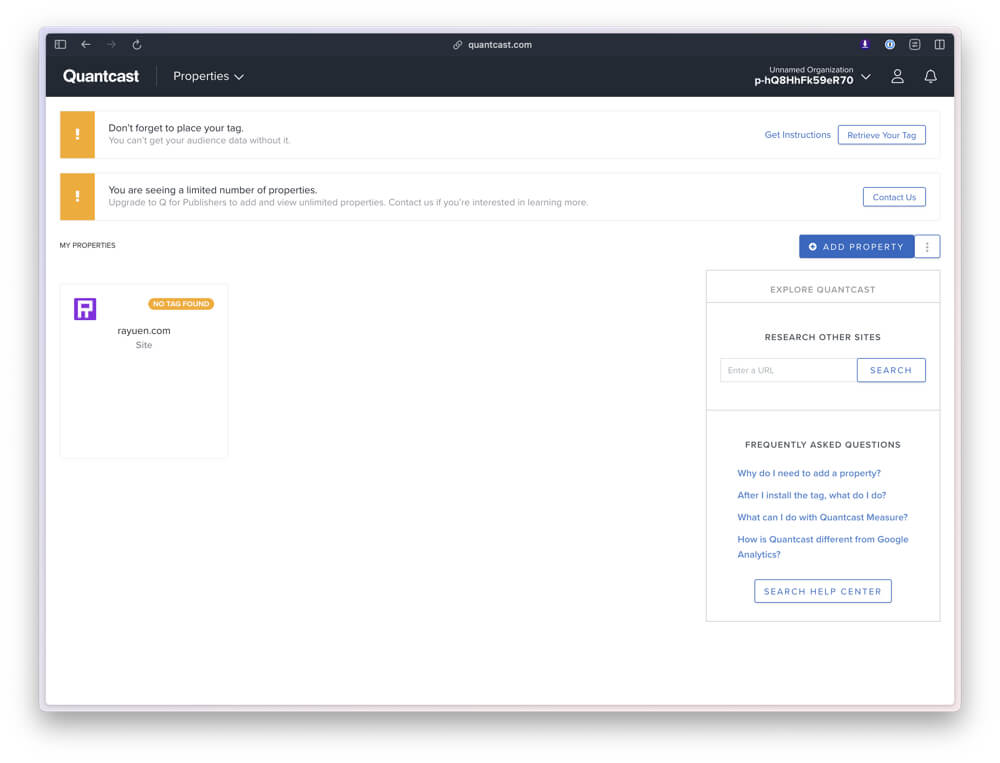
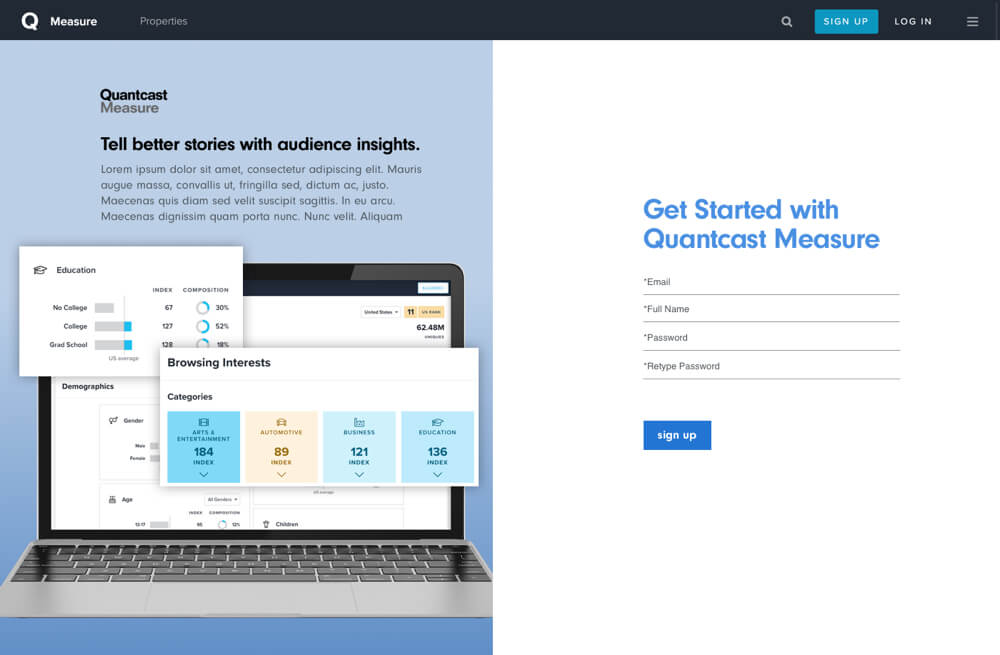
Through a series of successful experiments, we transformed the initial product setup screen from a blank state to have more functionality. Our main goal was to improve the success rate of tag installations. As users waited for data to appear after placing a tag on their website, we provided support content and encouraged exploration of other quantified sites to engage and assist them during this waiting period.
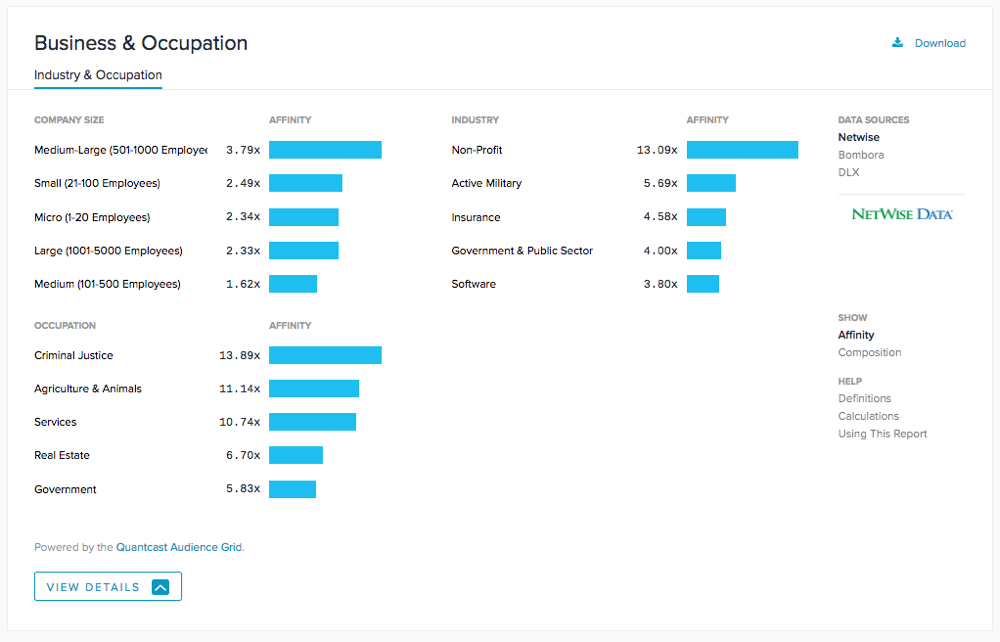
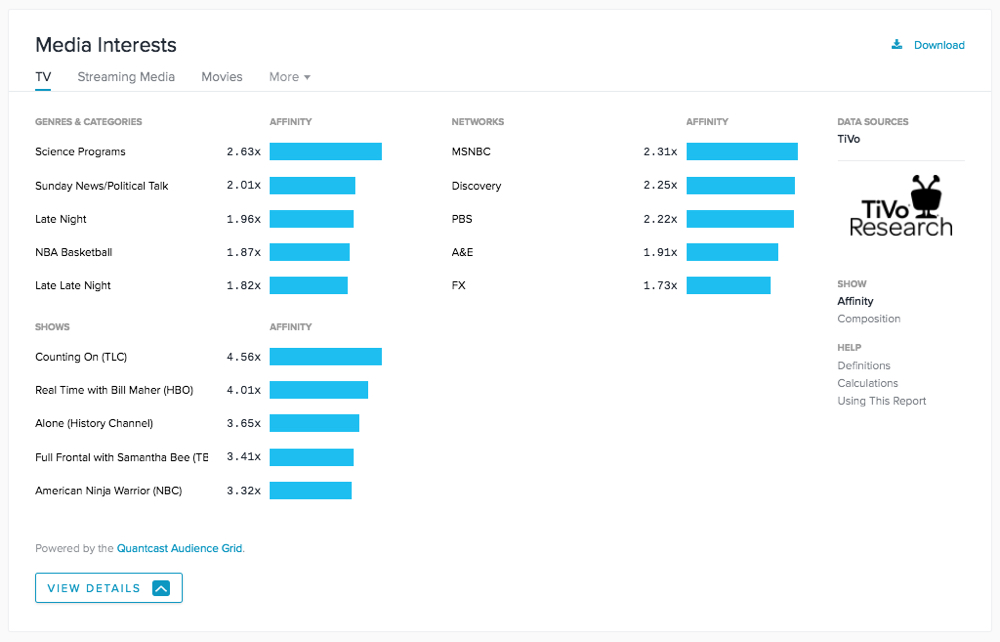
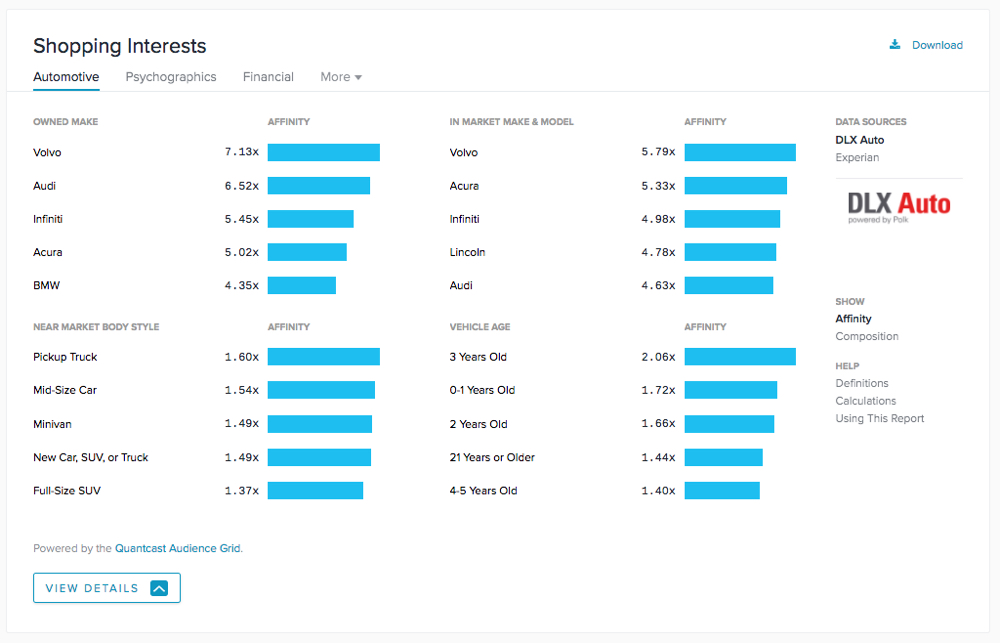
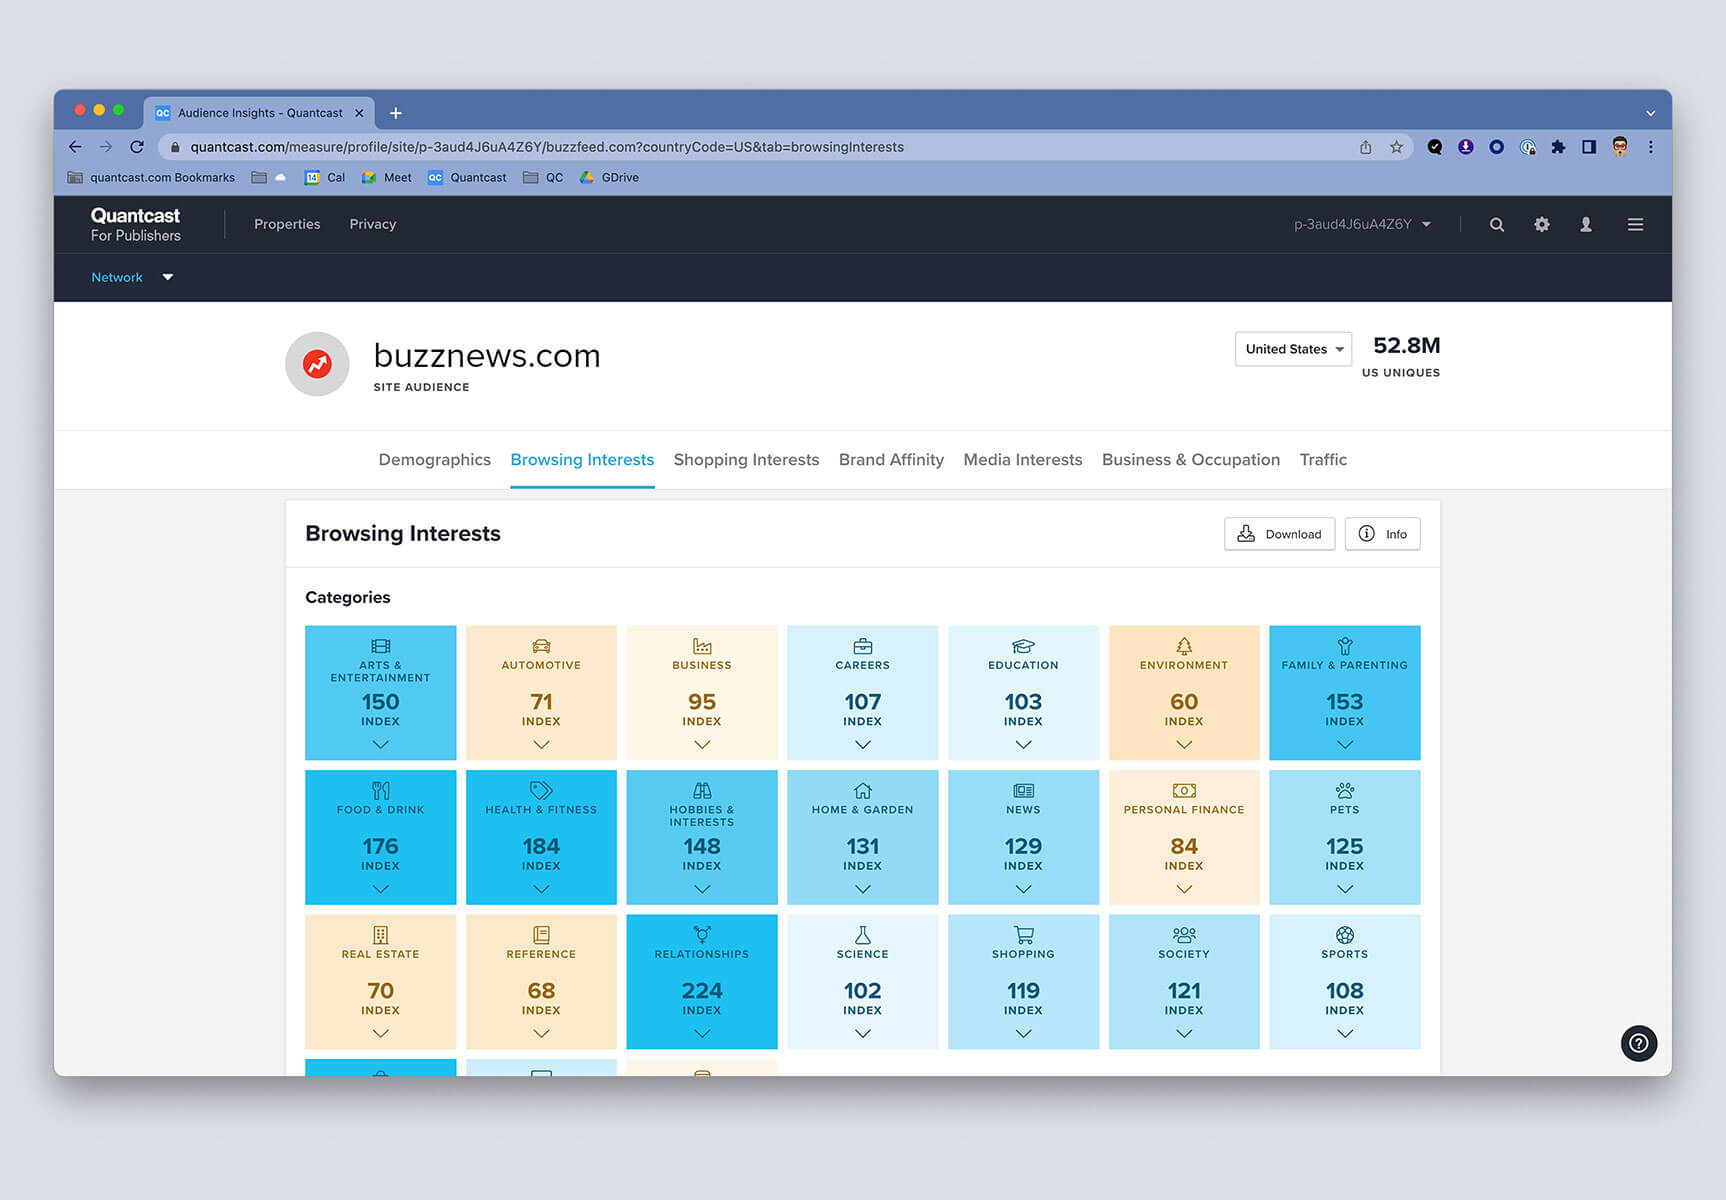
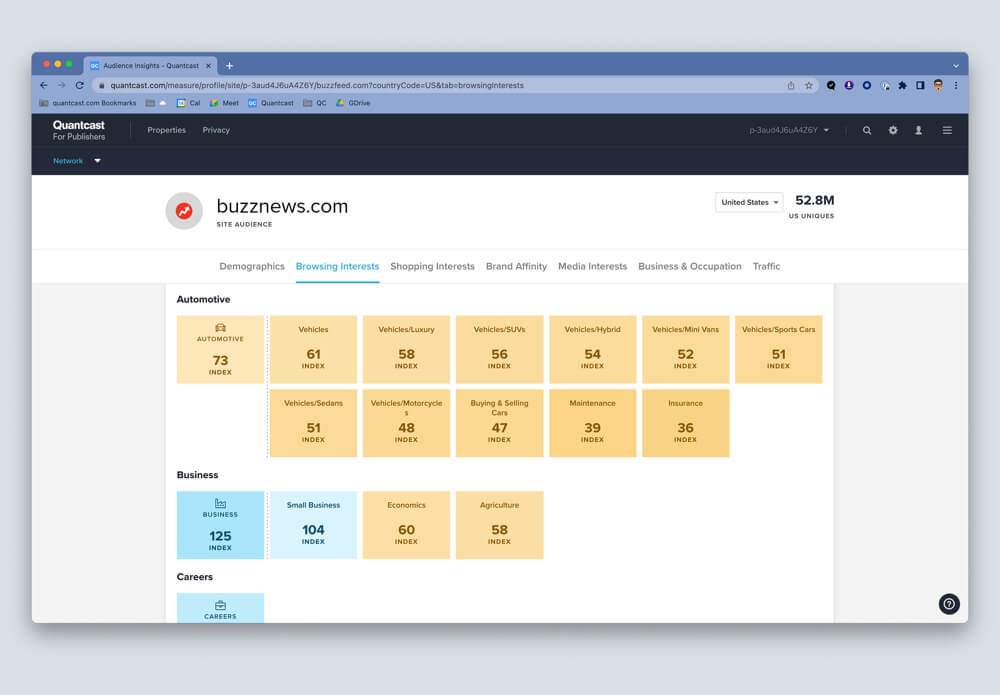
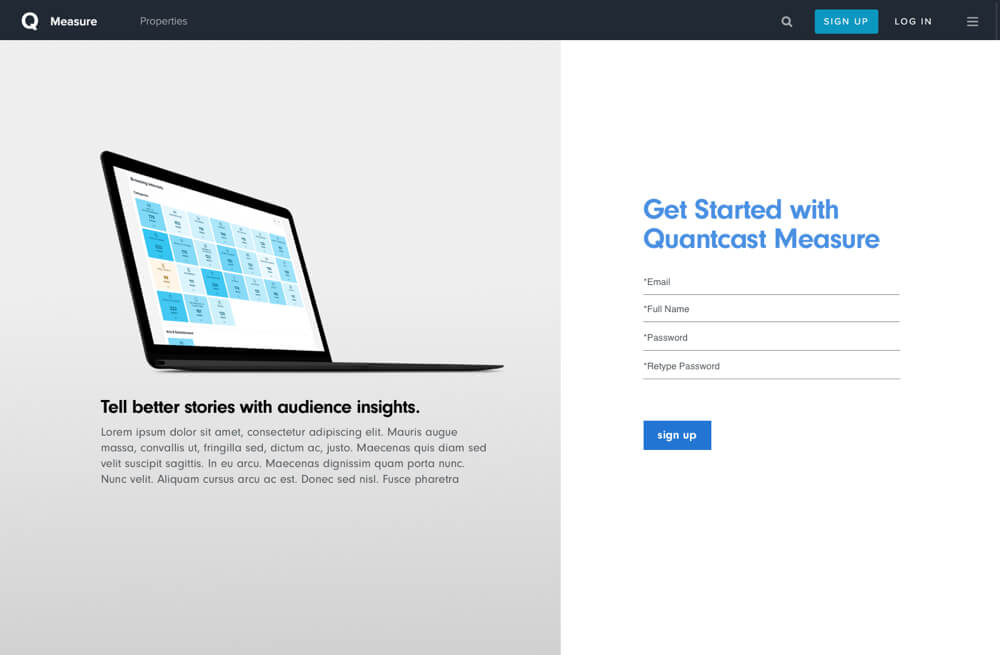
We conducted a well-received experiment redesigning the Browsing Interests tab in Measure to boost engagement. Previously, the tab had expandable charts, but we tested a visually appealing design resembling a heatmap to convey audience interest more effectively.
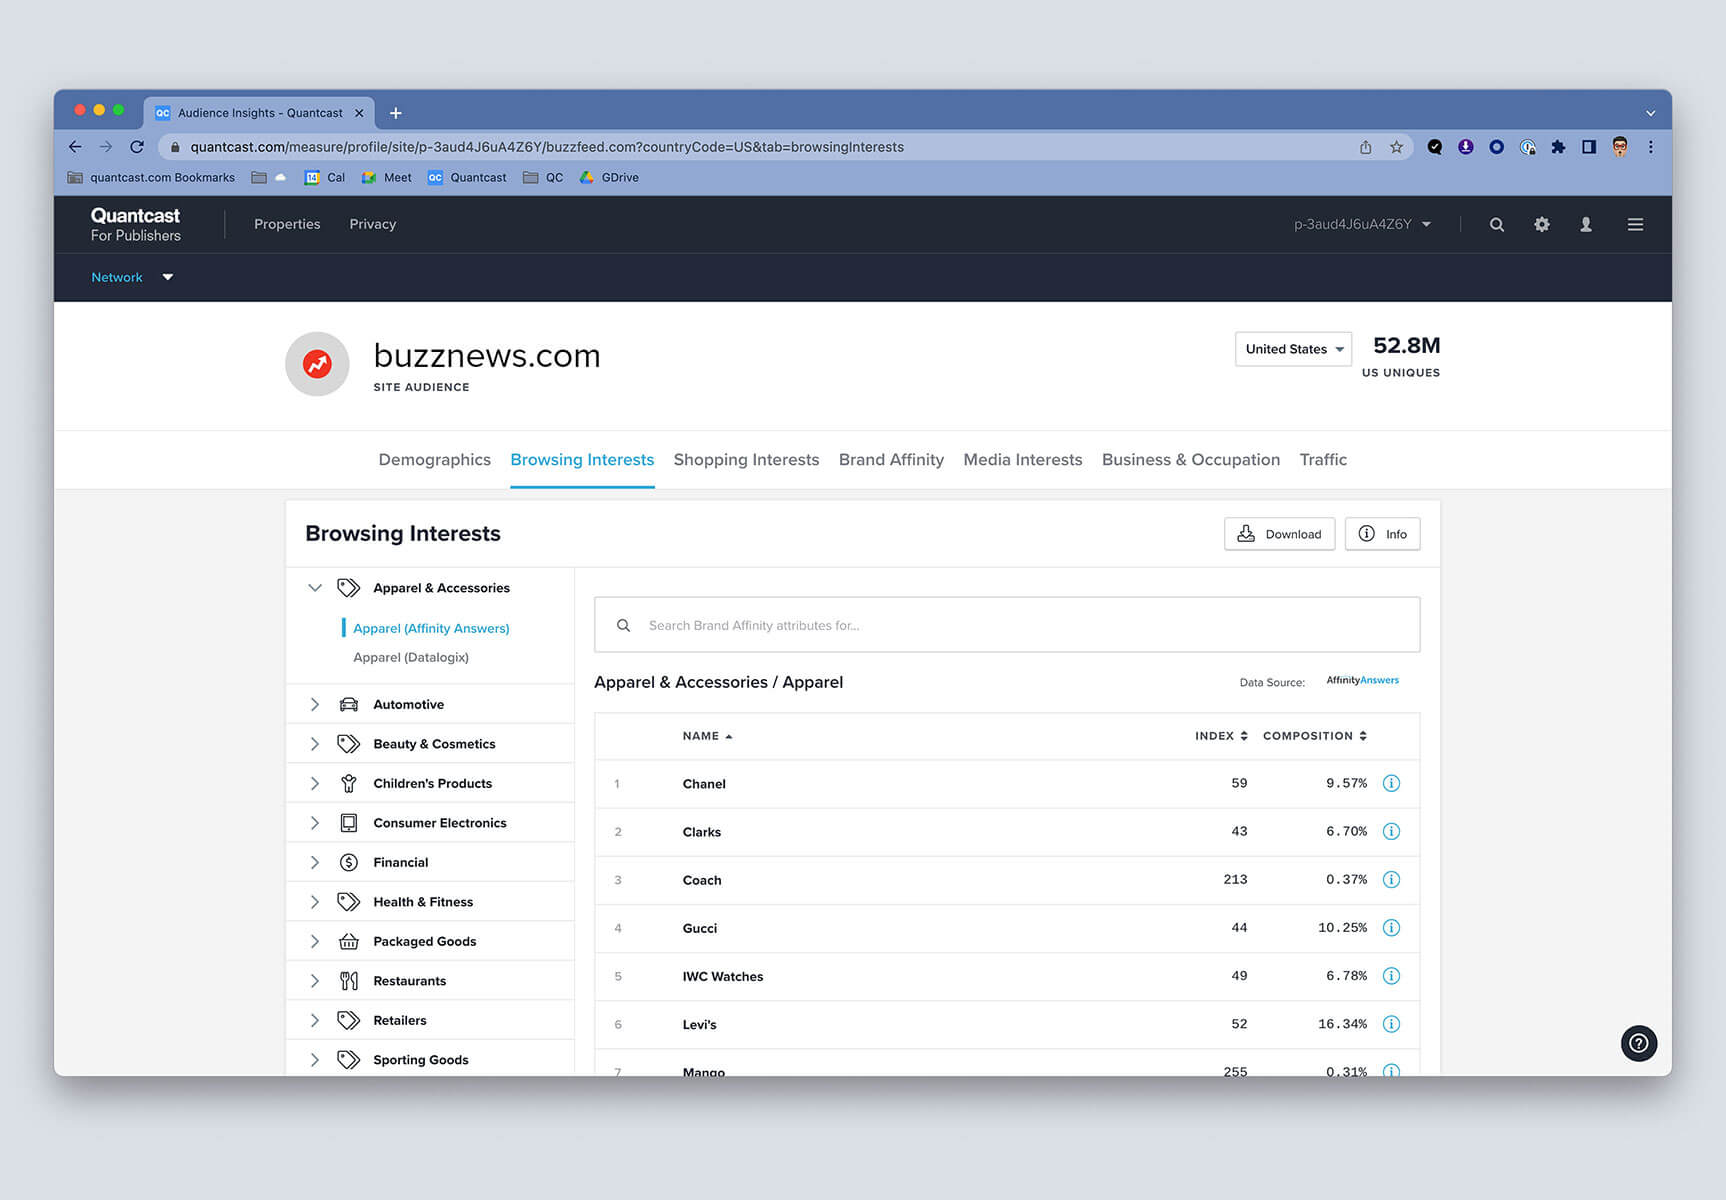
This redesign improved usability, providing users with quick access to insightful information. Our analysis revealed a significant increase in usage, leading to the implementation of this experiment into our product.
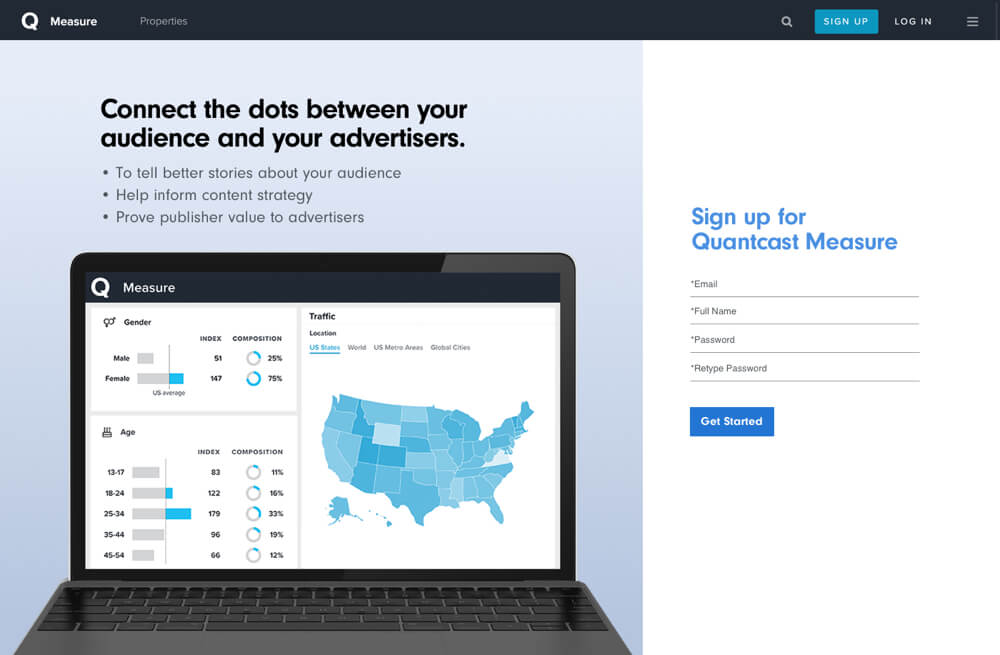
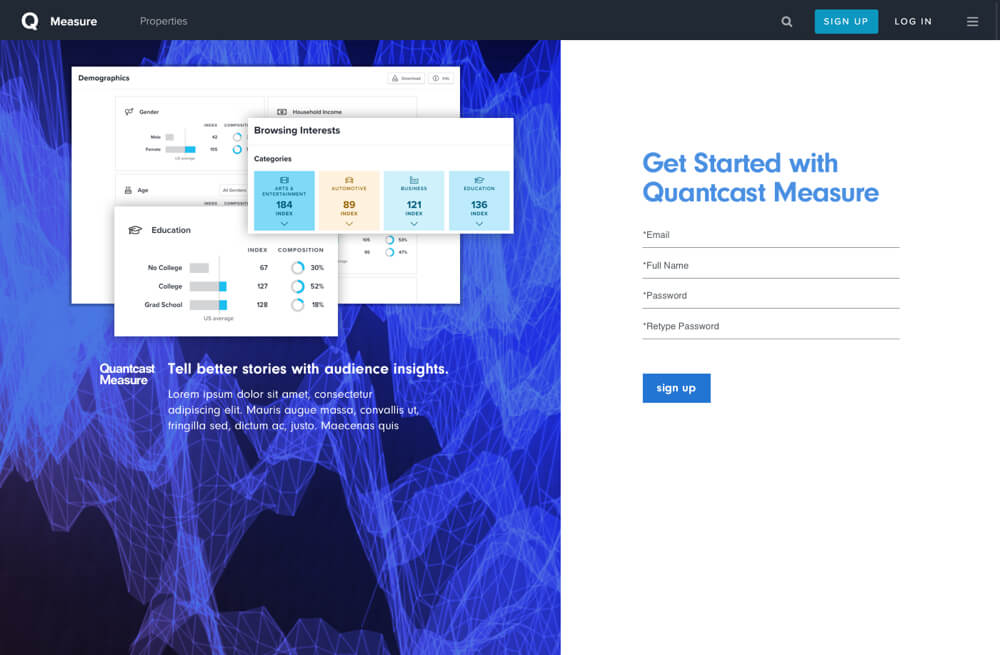
Quantcast Measure Onboarding
Retrospective
Embracing Data-Driven Design: Joining the Growth team marked my initiation into making design decisions grounded in data. This approach provided a systematic method of collecting, analyzing, and interpreting relevant data.
It's fun to build things and understand how they work! After recently beginning my journey into learning the fundamentals of PHP and Javascript, I found the idea of partnering with an engineer to collaboratively build and iterate on projects incredibly enticing.
Continuous improvement. Even if something performed well, if we have the time, we keep testing for more data and iterative improvement. Tests can be as simple as changing text to see what resonates better.
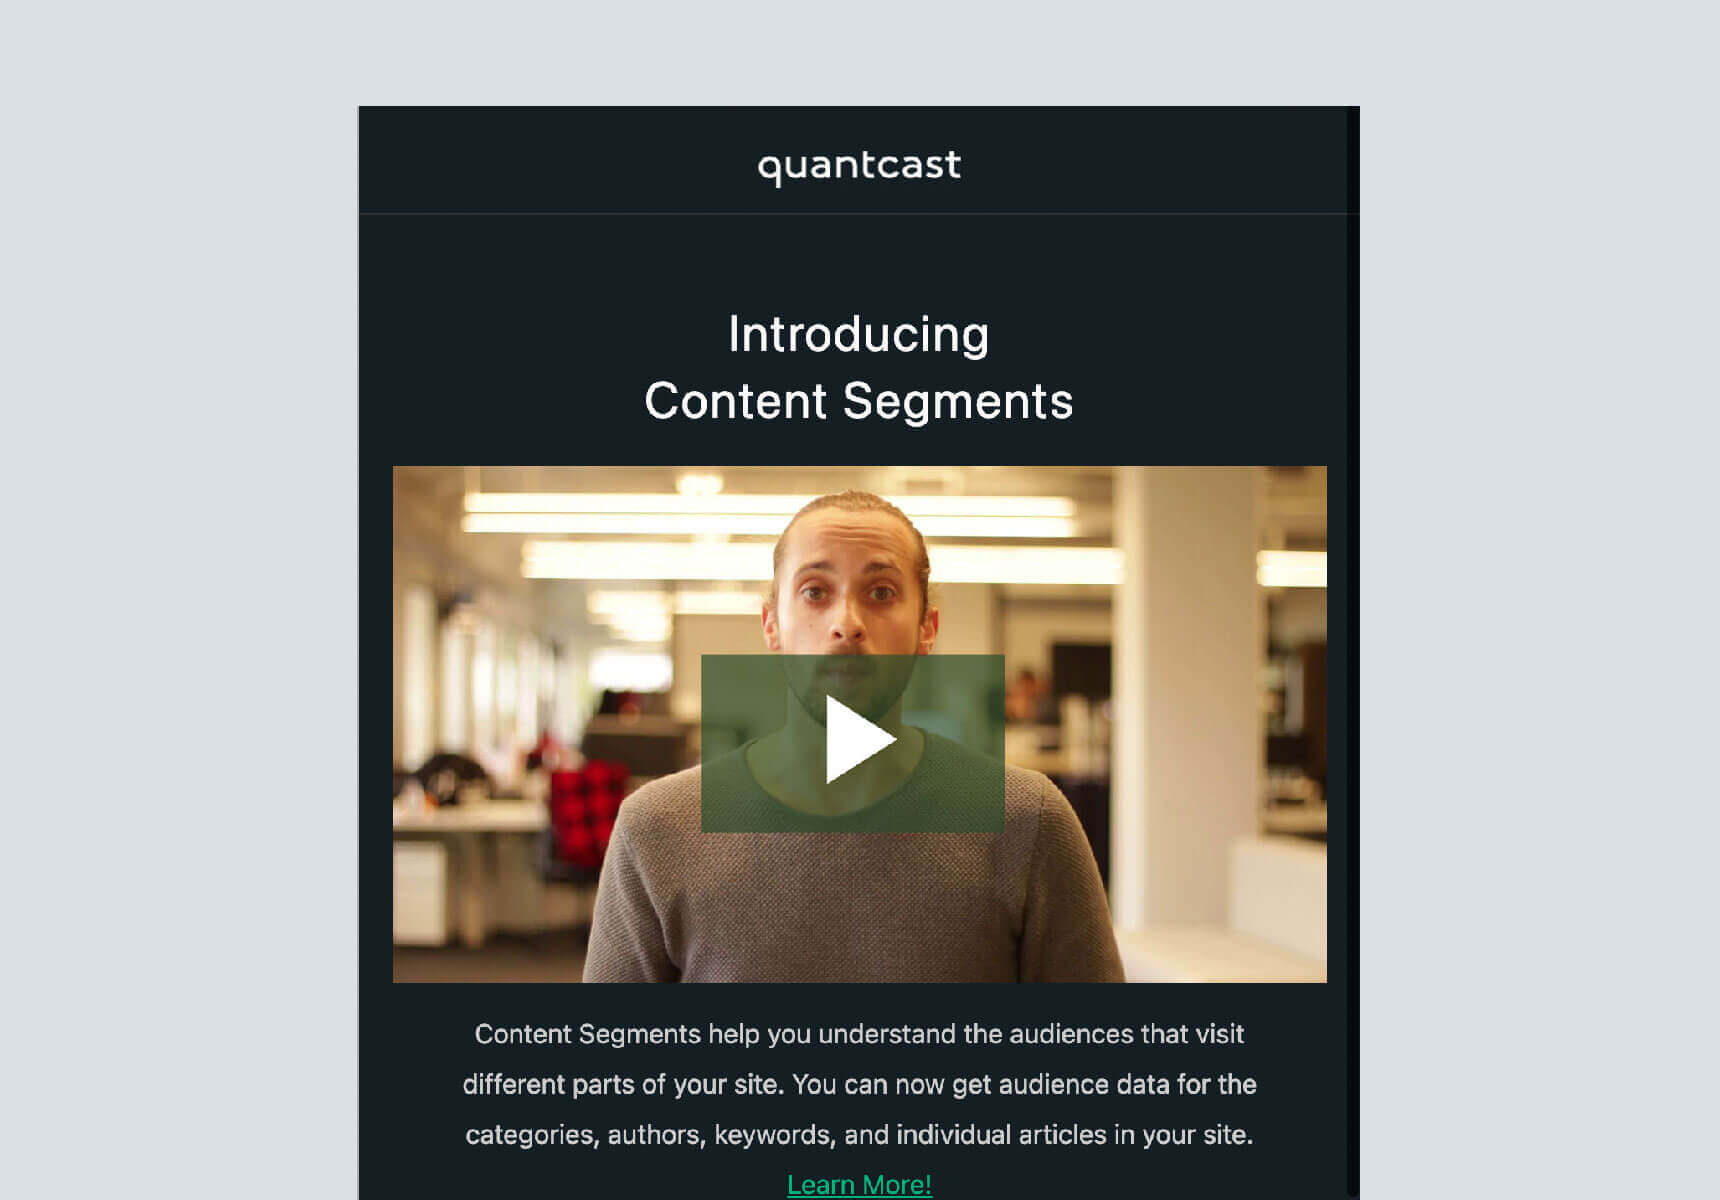
Product Announcement - Content Segments A
Product Announcement - Content Segments A
Quantcast Measure blank state